If you are already on our email list and want to be sure you receive updates in your inbox, email Michael Berton at mberton@pubintlaw.org. If you would like to join our email list to receive these updates, fill out this sign-up form and mark “Voting” as one of your interests.
Click on one of the below links to take you to that day of trial:
- Closing Press Conference
- Trial Day 4: December 14, 2017
- Trial Day 3: December 13, 2017
- Trial Day 2: December 12, 2017
- Opening Press Conference
- Trial Day 1: December 11, 2017
Trial Day 5: December 15, 2017
The final day of trial began with legislative respondents calling their second expert witness, Dr. Nolan McCarty. Dr. McCarty is the Susan Dod Brown Professor of Politics and Public Affairs and Chair of the Department of Politics at Princeton University. He was hired by legislative respondents to analyze petitioners’ expert reports by Dr. Jowei Chen and Dr. Christopher Warshaw, but not to opine himself whether the 2011 Map was gerrymandered. He was accepted by the court as an expert in redistricting, quantitative and political analysis, representation and legislative behavior, and voting behavior.
“It is possible under [my analysis of] the current map for Republicans to win 13 seats, but it’s not that common [under my analysis], so it doesn’t seem the plan was designed to create 13 Republican seats.” – Dr. Nolan McCarty
Before the court accepted him as an expert witness, David Gersch of Arnold & Porter Kaye Scholer LLP requested voir dire (the preliminary review of a witness) asking Dr. McCarty whether or not he has published any peer-reviewed articles simulating or analyzing the partisanship of congressional or other maps or if he has created or developed any measurement or method to determine gerrymanders. Dr. McCarty testified that he has not.
Rob Tucker of BakerHostetler LLP, counsel for the legislative respondents, began his examination of Dr. McCarty by asking him to walk the court through (1) his use of the Partisan Vote Index (PVI), a commonly accepted political science measurement, to measure the partisanship of each of Pennsylvania’s 18 congressional districts; and 2) his calculation of the probability that either political party in Pennsylvania secures a certain number of congressional seats under the current congressional map.
In his report, Dr. McCarty describes the PVI as, “the average partisan presidential vote in a district over the past two elections minus the average partisan presidential vote nationally over the same period.” Dr. McCarty explained his equation further. He started by using national voting data from the 2004 and 2008 presidential elections. He chose this data because he wanted national data and because presidential elections are more high-profile, partisan affairs, whereas statewide elections tend to be more idiosyncratic and often less closely contested. (He decided not to use data from 2012 and 2016 because at the time the 2011 map was created, those two elections had not yet occurred.) For each of Pennsylvania’s 18 districts, he then takes the average of the two election results for a district and subtracts from that the average national presidential vote from the same elections.
He transposes his PVI calculations into figures such as R+2 or R-2, with a positive value indicating that Republicans performed better by 2% in a given district and a negative value indicating that Republicans performed worse by 2% in a given district. By his calculations, the 2011 congressional map had 11 R+ districts, 6 R- districts and 1 district that had a 0 value, meaning it was neither favorable to the Republicans nor to the Democrats.
He testified that smaller PVI values indicate that districts are more competitive. An R+1 district, for example is not much more likely to be won by a Republican candidate. He went on to explain that just because a district has a higher R+ value, it does not mean a Republican will win that district every election. He testified that partisanship is not the only thing that can determine elections. He cited changes in national trends, the quality of candidates, the actual politics of an election, the popularity of a president, campaign spending and various other things can influence the outcomes of elections.
Next, he did calculations to identify the probability of how many times a Republican or Democrat might win one of Pennsylvania’s districts. Using congressional election data from 2004 through 2014, he calculated the proportion of times that a Democratic candidate could win a district election with a particular PVI score. He further testified that PVI averages in Pennsylvania generally shared the same trend as districts in other states. He then calculated the probability, not actuality, of each of the 18 districts with a particular PVI value of electing a Democrat. For example, even in R+1 districts, Democratic candidates had a probability of winning 23.3% of the time. He then added up the probabilities he calculated for each district, both for the 2002 congressional map and for the 2011 congressional map, to see how many districts the Democrats or Republicans had a probability of winning. Under Dr. McCarty’ analysis of the 2011 map, he projected that Democrats had a probability of winning 8 congressional seats.
He then studied the outcomes of 1000 elections with each of the 18 districts having the probability associated with its PVI value. Dr. McCarty likened this analysis to having 18 coins, weighting each coin based on the probabilities he computed, flipping each of those coins 1000 times, and then computing the number of times the coin landed heads, which he would equate to a Republican win in a district. After conducting this analysis, he concluded that Republicans in Pennsylvania are most likely to win 9 or 10 seats under the current congressional map. While it is possible for Republicans to win 13, it occurred only three percent of the time under r his calculations.
Dr. McCarty was then asked to testify about his opinion on petitioners’ expert witness, Dr. Chen. He testified that he believes Dr. Chen’s sample size is small and he disputed how Dr. Chen computed the partisanship of each district.
Dr. McCarty explained to the court that he used a regression analysis to analyze Dr. Chen’s simulated maps. He again used his coin flipping methodology for each of Dr. Chen’s two sets of 500 simulated maps. His results indicate that the most common outcome from Dr. Chen’s simulated maps is that Republicans get 11 seats, and that when he applied his analysis to Dr. Chen’s map, less than 10% of Dr. Chen’s simulated maps have 13 Republican seats. That the Republicans have won 13 seats under the enacted plan suggested to Dr. McCarty that Republicans have over performed or that Democrats have underperformed relative to historical standards. Had the outcome of 13 seats been due to an intentional partisan gerrymander, Dr. McCarty would expect that it would be a more frequent outcome in his simulated elections. Thus, Dr. McCarty says his results suggest the 13 seats currently held by Republicans cannot be attributed to the partisan features of the map.
Earlier in the week Dr. Chen criticized Dr. McCarty’s regression analysis and his choice of using 2004 and 2008 presidential election data, instead of using data from seven Pennsylvania statewide elections in 2008 and 2010. When asked about this by Mr. Tucker, Dr. McCarty responded that he did not think it made sense to use state election data because it might fluctuate more and because he could not calculate probabilities of winning seats without having national data. Dr. McCarty defended his regression analysis by saying Dr. Chen’s criticism was based on a sample of one out of a thousand, and he felt his regressions were fair because they were highly correlated with Dr. Chen’s results.
Mr. Tucker then asked Dr. McCarty about polarization. Dr. McCarty stated that he disagrees with petitioners’ expert witness Dr. Christopher Warshaw that the combination of partisan gerrymandering and polarization in Congress has a profound effect on democratic representation.
Dr. McCarty noted that Dr. Warshaw’s argument is essentially that in a polarized environment, voters of a losing party are less well represented than those of a winning party. Dr. McCarty noted, “That’s a natural consequence of elections. I don’t find that compelling.”
Dr. McCarty discussed results from his report in which he uses the DW-Nominate score, also used by Dr. Warshaw, to show that in fact there is not as much polarization in Congress as Dr. Warshaw contends. He testified that in competitive districts, for example, the gap between how conservatively or liberally legislators vote is considerably smaller. He believes this indicates representatives in competitive districts vote more moderately, and therefore, voters are not losing representation.
Dr. McCarty criticized the Efficiency Gap (EG), used by Dr. Warshaw to measure partisanship, because there are many other factors that can make the EG larger or smaller, such as geographic concentration of voters. He also testified that he does not believe the EG in Pennsylvania is as durable as Dr. Warshaw claims. He also testified that competitive districts can undermine the accuracy of the EG. Dr. McCarty ended his testimony saying he does not have any evidence to demonstrate that the 2011 plan gives Republicans a partisan advantage.
“A good measurement tool should project actual outcomes, correct?” – David Gersch, Arnold & Porter Kaye Scholer LLP
David Gersch then began the cross examination of Dr. McCarty. Mr. Gersch reminded Dr. McCarty that Dr. Chen used Pennsylvania congressional election data from 2008, 2010, 2012, 2014, 2016. He asked Dr. McCarty if it was acceptable to use only presidential election data to measure partisanship in congressional districts, which Dr. McCarty confirmed. Mr. Gersch then asked Dr. McCarty about an expert report he produced in a gerrymandering case in Florida in which he stated, “Use of presidential vote outcomes to predict congressional outcomes is problematic. First, it’s only a crude measure of partisanship and may not predict congressional voting patterns.” Nevertheless, Dr. McCarty defended his position to use presidential election data in this case so that he could evaluate Pennsylvania’s partisanship against national averages.
Mr. Gersch confirmed with Dr. McCarty that a prediction error occurs when probability does not match up to actual outcomes. Mr. Gersch then asked Dr. McCarty to walk through his results regarding Pennsylvania’s 7th district. By Dr. McCarty’s calculations, Democrats have a probability of winning the election in that district 52% of the time. But in reality, the Republican candidate won that district by a 20% margin in 2012, 2014, and 2016. Mr. Gersh noted, “That’s not the only place where there are prediction errors.” Dr. McCarty responded, “Yes, that’s true.” For example, in the real world, in 2012, 2014 and 2016, Republicans won 13 seats, but Dr. McCarty’s results show the probability that Republicans win this many seats only 3% of the time.
Mr. Gersch asked, “But when you come up with a predictor, you want a predictor that gets it right, isn’t that fair?” Dr. McCarty responded, “This simulation is demonstrated to show all of the possibilities, I am not trying to forecast the actual outcomes.”
Mr. Gersch noted that Dr. Chen’s results got correct the seats won by Republicans under the 2011 map for 18 districts in three elections, or 54 times, but that Dr. McCarty’s method got the correct number of seats only 3% of the time. Dr. McCarty responded, “Overall my measure predicted 10 Republican seats from the 2011 map, so it is not that far off.” Dr. McCarty conceded that a three seat difference is significant. Mr. Gersch asked, “Your results would say there would have been a greater chance for Republicans to win only seven seats in 2012 than for them to win 13 seats.” He confirmed that to be correct.
Mr. Gersch then asked, “A good measurement tool should project actual outcomes, correct?” Dr. McCarty agreed. Mr. Gersch pressed, “Therefore, one that succeeds in correctly forecasting elections should be the preferred method.” Dr. McCarty disputed that saying there could be other factors like bad candidates that explained the outcome rather than a bad methodology.
Mr. Gersch asked Dr. McCarty, “You understand when the enacted plan was made, Republicans controlled the state house, the senate and the governor’s office?” Dr. McCarty agreed. Mr. Gersch then showed Dr. McCarty the maps of the 7th and 12th districts and asked Dr. McCarty whether or not he thought the maps looked strange. Dr. McCarty responded, “I don’t have a metric for what is strange.”
Mr. Gersch asked Dr. McCarty about an interview he did in 2012 with WHYY after the 2011 map was created. The article reads, “Despite demographic patterns that favor Republicans, McCarty said it’s clear there is partisan gerrymandering in states where redistricting is done by legislatures dominated by a single party. Democrats did it in Maryland, and Republicans did in Pennsylvania.” Dr. McCarty did not recall the interview but reviewed a copy of it while on the witness stand. The court refused to admit the article in evidence ruling it hearsay.
Mr. Gersch then asked Dr. McCarty about his analysis of Dr. Chen’s report. Dr. McCarty confirmed that he could have computed PVI for Dr. Chen’s plans but instead he decided to use a regression analysis. Mr. Gersch walked through the differences between Dr. McCarty’s regression results and the actual PVI in Pennsylvania, which can be easily calculated, pointing out the difference between Dr. McCarty’s results and the actual PVI in 17 of the 18 districts. Dr. McCarty admitted to these errors in his data. Mr. Gersch then walked Dr. McCarty through a series of excel spreadsheets, showing the difference in 10 of Dr. Chen’s simulated maps between Dr. McCarty’s PVI results and actual Pennsylvania results. After reviewing all of these maps, Dr. McCarty confirmed that he can no longer say that his regression matched Dr. Chen’s PVI values. Mr. Gersch pressed Dr. McCarty on the fragility of the data he used. He noted that Dr. McCarty did not use state elections, but data from two presidential elections, while Dr. Chen used data from six state congressional elections. Mr. Gersch asked, “What would happen if one of the two elections he used was an anomaly. Wouldn’t that taint 50% of your measurement?” Dr. McCarty agreed, but noted that his goal was to create a predictive analysis. Dr. McCarty admitted he would have preferred to have more election data and that the data he used is a little bit more dated.
Dr. McCarty confirmed that over the last three elections, Republicans won 13 seats while Democrats won 5 seats. He went on to comment that over a longer history in Pennsylvania, however, Democrats at times have also won a considerable number of more congressional seats. Mr. Gersch posited that the PVI predictor Dr. McCarty used does not do a good job of predicting actual election results in Pennsylvania. Dr. McCarty eventually agreed but noted that nationally speaking it does do a good job.
Mr. Gersch then asked Dr. McCarty about his analysis of petitioners’ other expert witness, Dr. Christopher Warshaw. Dr. McCarty admitted that his data does not show that Democratic and Republican representatives are actually voting similarly and more moderately in competitive districts, as he observed in his report. Instead he restated his conclusion that he believes that the gap between the votes of Democrats and Republicans in moderate districts is smaller.
Relatedly, Mr. Gersch also asked Dr. McCarty about an editorial he published in the Washington Post. In that editorial he wrote, “While significant disagreement persists as to how much voters have polarized by taking increasingly extreme views, there is a consensus that voters are much better sorted within the party system. Conservative voters are much more likely to identify as Republican and liberals as Democrats than two generations ago. Moreover, voters’ partisanship increasingly predicts their positions on issues.”
Mr. Gersch moved on to ask Dr. McCarty about his criticism of Dr. Warshaw’s expert report. During this portion of the cross examination, Dr. McCarty agreed to many of the claims Dr. Warshaw made in his report, which he previously disputed. For example Dr. McCarty agreed that it is true that in recent history, legislators in Pennsylvania have cast votes on policies that are more extreme than the desired policies of the average voter in their districts, and that may lead to more polarization, as Dr. Warshaw said in his report. Dr. McCarty confirmed that he did not investigate or review Dr. Warshaw’s calculation of the Efficiency Gap (EG). He ultimately agreed that the EG in Pennsylvania, as demonstrated in Dr. Warshaw’s report, does demonstrate partisan advantage.
Dr. McCarty was briefly cross-examined and then redirected. The legislatives respondents then rested their case, as did the General Assembly, the Executive respondents, the Lieutenant Governor, and the intervenors. The court then admitted a variety of exhibits and depositions submitted by both petitioners and respondents.
Petitioners then called Dr. Jowei Chen as a rebuttal witness. Daniel Jacobson of Arnold & Porter Kaye Scholer LLP conducted the rebuttal examination.
“Her critique is entirely directed at a feature that is simply not in place in the simulation algorithm that I used with my algorithm in this case. It’s just puzzling. And anyone who looks at the code, could see that.”
Dr. Chen testified that in her report, Dr. Cho did not analyze his algorithm. He further testified that throughout her entire testimony yesterday, she referred to an algorithm he used in a 2013 paper, not the algorithm he used in the expert report he produced for this case. Dr. Chen explained to the court that in addition to using the wrong algorithm, Dr. Chen misunderstood his algorithm to be deterministic, when in fact it is not. He re-explained his algorithm. The first step of his algorithm instructs the computer to pick a random block. The second step of his algorithm is to pick an adjoining, neighboring block at random. The third step is to again pick a random block. And so on, the algorithm continues at random. Therefore, the entire basis of Dr. Cho’s critique of Dr. Chen’s work is incorrect in that she references a completely different algorithm and she completely misunderstands his algorithm.
Mr. Jacobson further asked if Dr. Cho could have reviewed Dr. Chen’s algorithm and understood that it is in fact random, not deterministic. Dr. Chen confirmed that she could have as he made it available as part of his report. Dr. Chen testified that Dr. Cho’s further testimony that he only disclosed his algorithm to the academic community in a footnote was incorrect. He in fact published a full article on his algorithm and made his algorithm fully available online. He also testified that Dr. Cho’s claim that he used a binary executable is false.
Mr. Jacobson also asked Dr. Chen to respond to Dr. Cho’s critique that Dr. Chen did not pay attention to the Voting Rights Act (VRA) in his simulations and should therefore throw out hundreds of his simulated maps. Dr. Chen confirmed for the court that in fact he applied a constraint in one of his two sets of simulation maps to ensure one district with an African American population of over 50%.

Mr. Jacobson and Dr. Chen then discussed Dr. Cho’s criticism that his algorithm did not fully account for traditional districting criteria. He refuted that criticism. In fact he instructed the algorithm to, among other crieteria, avoid county and municipal splits. He repeated for the court his results: “There is a wide gap in that the enacted map split 28 counties, while my simulated maps split 12 to 19. The enacted map significantly subordinated traditional redistricting criteria of avoiding county and municipal splits. The enacted plan was not created to adhere to traditional districting criteria.”
Dr. Chen then rebutted Dr. McCarty’s methodology, specifically that he uses election data from across the nation to predict what will happen in Pennsylvania’s congressional districts. Dr. Chen testified that he knows of no peer-reviewed articles or methodologies that use this type of method or data, noting, “That sort of conversion methodology would be considered inaccurate by academics.” Dr. Chen also reviewed the anomalies he found in Dr. McCarty’s data. For example, Dr. McCarty shows that in Pennsylvania 7th and 8th districts, although they have higher pro-Democratic PVIs, he also predicts that these districts have a lower chance of democratic victory. Dr. Chen testified that Dr. McCarty’s data is therefore unreliable.
Dr. Chen refuted Dr. McCarty’s claim earlier today that Dr. Chen did not provide enough information for Dr. McCarty to calculate PVI of his simulated maps. Dr. Chen testified that he was able to run PVI of his simulated districts, using the data he turned over, in about ten minutes, and that the average political scientist should be able to do such a calculation in about 30 minutes to an hour.
Dr. Chen was briefly cross-examined by Patrick Lewis, counsel for legislative respondents. The court set a deadline for proposed findings of fact and conclusions of law by 9 a.m. on Monday, December 18. The court then closed the record.
Off the record, Judge Brobson stated: “On behalf of Commonwealth Court, I certainly want to thank counsel for the extraordinary effort on all sides to get this rather extensive record completed in a week. I know personally it was not without great effort on your parts and there was a lot of professionalism in and outside of this court room and I want to thank and commend you for that.”
Trial Day 4: December 14, 2017
Court began this morning with the legislative respondents putting on their first expert witness. Dr. Wendy Tam Cho is a professor at the University of Illinois at Urbana-Champaign. The legislative respondents also withdrew one of their experts, James Gimpel, who had been scheduled to testify today.
Dr. Cho was retained by the legislative respondents to evaluate petitioners’ expert witness reports by Dr. Wesley Pegden and Dr. Jowei Chen.
“I think [Dr. Pegden’s] claims are overbroad in the context of redistricting. In terms of the theorem and his math, I think his report is fine.” – Dr. Wendy Tam Cho
Patrick Lewis, attorney from BakerHostetler representing the legislative respondents, examined Dr. Cho. She claimed that Dr. Chen does not provide sufficient detail about his algorithm in his expert report, and she criticized his approach on the theory that it does not create random, unbiased maps, but only starts with a random map. She also criticized his choices of redistricting criteria. (The legislative respondents have refused to disclose the actual criteria used to draw Pennsylvania’s plan.) She further testified that his method is unreliable and that he did not create a large enough sample size of maps to draw his conclusion that the current map could only have been drawn because of partisan intent.
Dr. Cho then began testifying about a version of Dr. Chen’s algorithm which she manipulated and used, with a different data set, to analyze his work. At this point, petitioners’ counsel objected to her testimony, on the grounds that the parties had agreed to disclose to one another the code used by their experts, and Dr. Cho had not previously disclosed her code for this analysis. Judge Brobson granted the motion, and struck from the record all testimony regarding the algorithm Dr. Cho used to analyze Dr. Chen’s report.
Dr. Cho next testified about Dr. Pegden’s expert report. She disagreed with his conclusion that the current map is an outlier among his universe of possibilities. She opined that being an outlier among one particular sample size is not sufficient to show that it is an outlier among a larger, more global sample size. Furthermore, she does not challenge his theorem, but she does contend his theorem cannot be properly applied to redistricting.
“His approach doesn’t meet the rigor of the law. You have to follow the law. You have to understand how redistricting works…We agree on his theorem. I think it’s really interesting. But it doesn’t apply to redistricting in the way that he thinks it applies to redistricting.”
Judge Brobson asked her to explain further why Dr. Pegden’s theorem does not apply to redistricting. She responded, “One of the limitations is the way he defines a valid map is incorrect. He leaves out incumbency protection and preserving cities. He didn’t preserve population equality at the same level as the current map.” Dr. Cho gave the example that the enacted map preserves 97.3% the state’s municipalities, but Dr. Pegden’s maps may not maintain this preservation, and argued that he is therefore comparing apples to oranges. She went on to contend that the maps his method created are all too similar to one another and to the current map, as they change only one voting precinct border at a time. “His conclusions are overbroad for what he’s done.”
“I understand what Dr. Pegden is trying to do whether or not I see his exact code because he has described it well enough. I understand tools and how tools work. I felt like I could understand what he was doing without looking at his exact code.” – Dr. Wendy Tam Cho
After a lunch recess, Mr. Gersch cross-examined Dr. Cho. He began by discussing her criticism of Dr. Chen’s report. In her report she states, “Chen does not describe his algorithm in any detail in his report…Given that the algorithmic details determine the output produced, omitting the details is not acceptable.” During the cross examination, Dr. Cho testified that she chose not to review or run Dr. Chen’s algorithm, code, or data, all of which were offered to her under a confidentiality agreement she refused to sign. All of the other experts in the case signed such confidentiality agreements and received the various data and codes.
Mr. Gersch next conducted a line of questioning regarding Dr. Cho’s criticism that Dr. Chen failed to use incumbency protection as a criteria in his calculations. Mr. Gersch asked, “Is partisan protection of incumbents a legitimate legislative goal?” Dr. Cho responded that incumbency protection is a traditional districting principle, but that she does not have a legal opinion as to whether or not it is a legitimate legislative goal. Dr. Cho then testified, “One of the reasons that legislators protect incumbency is because when they make the map you have to satisfy enough of them to get their votes [to approve the map]. So yes, that’s a constraint whenever you draw a map, whether or not you have the votes.” Mr. Gersch responded, “Just to make a legislator willing to vote for it [a map], that doesn’t independently make it a legitimate goal of districting, does it?” She responded, “I’m not saying it’s a legitimate goal or not. I’m merely saying it is a constraint on the process.”
He went on to ask Dr. Cho, “Is it a good idea to build a map on an already gerrymandered map?” After much back and forth in which Dr. Cho did not directly answer the question, petitioners’ counsel showed a video from August in which Dr. Cho states: “Incumbency does not make sense if a current map is arguably a gerrymander. If a current map is arguably a gerrymander it doesn’t really make sense to preserve it.” Dr. Cho confirmed that she made that statement.
Next, Mr. Gersch questioned Dr. Cho about her critique that Dr. Chen should have ensured that his simulated maps complied with the Voting Rights Act (VRA). In her report, Dr. Cho claims that 741 of Dr. Chen’s simulated maps should be thrown out because they do not comply with the VRA, on the grounds that they do not include a minority-majority district with as large a black voting-age population as Pennsylvania’s current 2nd Congressional District. Mr. Gersch asked Dr. Cho if she had looked at Dr. Chen’s data to determine if his simulated maps in fact do not comply with the VRA. She confirmed that she had not.
Mr. Gersch then discussed with Dr. Cho the three-part legal test for when a district satisfies the requirements of the Voting Rights Act: the minority group must be able to demonstrate it is large and geographically compact within a single district; it must show that it is politically cohesive; and, it must demonstrate that the level of white votes are sufficient to block or defeat the voting preferences of the minority. Dr. Cho admitted that she had not conducted any work to check whether any of Dr. Chen’s simulated maps met any of these legal requirements, nor had she done any analysis to check whether any districts in the current congressional map comply with these legal requirements. Mr. Gersch also pressed Dr. Cho on her criticism that Dr. Chen’s simulated maps failed to preserve cities at the same level as the current map. In fact, Dr. Chen did preserve cities in his simulated maps.
Mr. Gersch moved on to discuss with Dr. Cho her analysis of Dr. Pegden’s report. She criticized that Dr. Pegden’s report did not make clear whether his simulations created one trillion maps or just took one trillion steps. Dr. Cho testified that she did not review his code, which she is aware has been publicly available on his website for most of the last calendar year, to answer this question before making this criticism. She countered that she did not need to review the code saying, “There is a difference between code and doing the algorithm. For example, I understand what Dr. Pegden is trying to do whether or not I see his exact code because he has described it well enough. I understand tools and how tools work. I felt like I could understand what he was doing without looking at his exact code.” Gersch pressed her further, “But you testified on direct [examination] that he didn’t describe his algorithm in enough detail?” “That’s correct, he didn’t give me exact steps.”
Dr. Cho further criticized Dr. Pegden’s theorem as not being applicable to redistricting. She testified that she did not claim any mathematical errors in his report, simply that his findings are overbroad. She asserted Dr. Pegden should have imposed additional constraints in his map generations, including: not splitting municipalities, adhering to incumbency protection, and using a more stringent test for equal population. But she noted that she did not have time to delve into his code or algorithm or theorem or view his simulated maps to really confirm the level to which he implemented these constraints and that it was conjecture that he did not maintain municipalities in creating his maps. Mr. Gersh also asked Dr. Cho about her criticism of Dr. Pegden’s use of the mean-median gap to determine partisan bias, as she believes that is a mathematical analysis and not necessarily appropriate to evaluate partisanship in redistricting. She noted that she had not done any computations to substantiate this criticism.
Mr. Gersch asked Dr. Cho if she has any approaches to measure whether a map is gerrymandered. She testified that she has multiple approaches and multiple measures of partisan bias of maps and that she can run such approaches on a supercomputer, in fact the fastest research supercomputer in the world. Mr. Gersch asked if she had run any of her approaches on her supercomputer in order to substantiate her criticisms of Dr. Pegden or Dr. Chen. She testified that she chose not to and that she was not asked to and that she did not have enough time to do so. She did not believe she needed to do any such calculations to substantiate her criticisms.
Clifford Levine, representing Lieutenant Governor Michael Stack also cross examined Dr. Cho. In particular, he asked her about this article she published last year that is at odds with some of her claims in this case.
“She did not do the work required of an expert witness.” – David Gersch
Patrick Lewis then conducted a brief redirect. After the redirect, counsel for the petitioners moved to strike Dr. Cho’s testimony in its entirety on the grounds that she had not done the work of an expert. Mr. Gersh noted that when someone signs up to be an expert witness, especially one that examines the work of other expert witnesses, that person needs to do the work. She made criticisms of the work of the petitioners’ experts even though she had done no work or computations to support her criticisms. Dr. Cho did not look at Dr. Chen’s code or data, nor did she review Dr. Pegden’s code or data. She chose not to run her own methodology.
Judge Brobson denied the motion, but noted that the motion and response are on the record and that petitioners may feel free to argue to the Pennsylvania Supreme Court that her testimony should be disregarded.
In standard court proceedings, once the respondents or defendants have rested their case, the petitioners or plaintiffs are able to present rebuttal evidence to refute or challenge any of the evidence or testimony presented during the respondents’ case. In the interest of time and because the legislative respondents’ second expert witness could not be available until Friday morning, the court decided to go out of order and allow the petitioners to call their first rebuttal witness late this afternoon.
“It is so carefully crafted that even when you make the smallest moves, every small thing you do makes the current map fairer as measured by the mean-median gap.” – Dr. Wesley Pegden
Ben Geffen examined the first rebuttal witness, Dr. Pegden. Mr. Geffen first asked Dr. Pegden to respond to Dr. Cho’s claim that the universe of possibilities that Dr. Pegden used in his report is not large enough, or does not show all the possibilities, to show that the current map is an outlier and that he therefore makes too broad a claim about the current congressional map. (To learn more about Dr. Pegden’s report and initial testimony, read our update from yesterday.) Dr. Pegden responded that, “Our theorem allows us precisely to conclude that a particular state is unusual with respect to the entire space, even if the space is giant and many of its characteristics are not known. This is the very breakthrough of our paper.”
He went on to provide the following example: “Imagine that you’ve landed in a new city. You know nothing about the restaurants in that city. You offer your taxi driver a big tip to take you to a typical, random restaurant in the city. He takes you to one. And it turns out to be a bad restaurant, with bad food. Perhaps it’s too spicey or the portions are too large. Once you’re done eating, you start wandering around the rest of the city, and you realize that all of the nearby restaurants you come upon are better. And as you continue wandering, you discover it’s harder and harder to find another restaurant as bad as the one you just ate in.”
In this analogy, he explained, the restaurant represents the current congressional map, which is what Dr. Pegden’s simulated maps start with. The taxi driver is the mapmaker. And the metric for determining what constitutes a bad restaurant is the mean-median gap, which is the metric Dr. Pegden employs to determine whether his simulated maps have more or less partisan bias than the current map.
Dr. Pegden testified, “The point of my theorem is that even though it’s true that you can’t characterize the distribution of all possible restaurants in this city, because you haven’t explored all the restaurants, you don’t actually have to know how many restaurants there are or how many are bad. But the theorem can tell you that it is atypical for a restaurant in this city to have bad food and be surrounded by better food.”
Mr. Geffen asked Dr. Pegden to respond to Dr Cho’s testimony that Dr. Pegden’s methodology is not well suited to analyze redistricting. Dr. Pegden responded, “Redistricting is not only one potential application, it is literally the application we used to illustrate our theorem.” He went on to explain that the Proceedings of the National Academy of Sciences, which published the article describing his theorem and its application in redistricting, is not exclusive to mathematicians. And that the paper has been reviewed by mathematicians, statisticians, and political scientists, and he knows of no other critiques published besides Dr. Cho’s.
Next, Mr. Geffen asked Dr. Pegden to respond to Dr. Cho’s testimony that swapping a single voting precinct in generating a new simulated map does not make large enough changes to make a truly new map. Dr. Pegden answered saying, “When I first ran my method on Pennsylvania, before I started, I didn’t know if it would work. Looking at election results it seems likely that the current districting has a Republican bias, but I wasn’t sure. What is remarkable is that it does work. It is so carefully crafted that even when you make the smallest moves, every small thing you do makes the current map fairer as measured by the mean-median gap.”
Dr. Pegden also responded to Dr. Cho’s questioning whether his method made a trillion changes or a trillion maps. He noted that as part of his expert report he had submitted the full article describing his methodology and theorem and that Dr. Cho could have easily reviewed that paper to answer her question. He went on to explain that while there may be some repeat maps, the data he presents in his report show that even if there are repeat maps, that would not affect his conclusions regarding partisan bias and anti-competitiveness.
Dr. Pegden also responded to Dr. Cho’s criticism that he did not constrain his maps to have completely equal populations. He noted that if you wanted to modify the method of generating simulated maps so that it follows the legal requirement of equal population, you could do so. But even small deviations in population constraints cannot account for the fact that the median-mean gap of the current map is higher than any of the other maps created in his method.
Dr. Cho had also criticized his choice of measuring partisan bias. Mr. Geffen asked, “Could someone alter your source code such that it used actual district seats instead of the median-mean gap? Dr. Pegden answered, “You wouldn’t even have to alter the code.” Months ago, Dr. Pegden made freely available on his website code that can do exactly this.
Dr. Cho noted during her testimony that she did not have time to make calculations to analyze Pegden’s method. Mr. Geffen asked Dr. Pegden, “Is it possible to use your code to run a new series of maps in less than a week? Dr. Pegden responded that his algorithm can generate a million maps in one second, such that in one day, or even in one hour, anyone could easily generate enough maps to do a statistically significant analysis. He also noted that after just the first second of generating new maps, he never again encounters any maps with as much partisan bias as the current congressional map.
After a brief cross examination of Dr. Pegden, court recessed for the day. Tomorrow the court will hear from respondents’ second expert witness, Nolan McCarty, and then hear the remainder of the petitioners’ rebuttal.
Trial Day 3: December 13, 2017
Day three of trial began with staff attorney Ben Geffen examining expert witness Dr. Wesley Pegden.
“The current Congressional districting was very carefully crafted to ensure a Republican advantage.” – Dr. Wesley Pegden
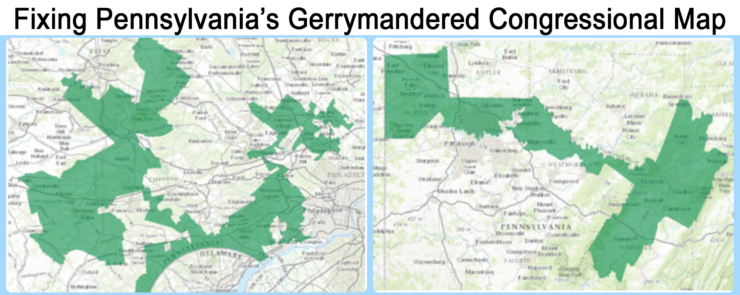
Dr. Pegden is a Pennsylvania native from Pittsburgh and an associate professor in the department of Mathematical Sciences at Carnegie Mellon University. He focuses on discrete mathematics and probability. Petitioners’ retained Dr. Pegden to prepare an expert report analyzing whether Pennsylvania’s current U.S. Congressional map is an outlier with respect to partisan bias. Dr. Pegden found that Pennsylvania’s map is “indeed a gross outlier with respect to partisan bias.”
Dr. Pegden testified that he and his colleagues created a new, rigorous statistical theorem to show how one configuration might be an outlier compared to a universe of possible alternative configurations. This theorem could be used across a variety of disciplines such as chemistry and statistical physics. In this case, he uses the theorem to compare Pennsylvania’s congressional map to six sets of a trillion alternative congressional map configurations and two sets of a half trillion maps. The code and software he developed to conduct his analysis are available on his website and can be downloaded and used by anyone.
Dr. Pegden testified that his analysis starts with Pennsylvania’s current U.S. Congressional map. From the current map, his method randomly selects a precinct on the boundary of two neighboring congressional districts, for example, a precinct on the boundary of the 3rd and 5th districts. He uses precinct data because it is the smallest, publicly-available data unit that contains voter preference. The method then checks to see if the precinct swap satisfies certain constraints similar to traditional redistricting criteria such as keeping a district contiguous, compact, and roughly equal in population size. If the swap satisfies these constraints, the computer makes that change and creates a new congressional map. If it violates those constraints, the computer does not make the swap and does not make a new map. The method then moves on and continues to create map after map after map in an iterative process.
Dr. Pegden testified that almost all of these maps had a lower Republican partisanship bias than the actual enacted map. The measure of partisan bias he used was a traditional measure that is known as the Median vs. Mean test and has been used to study the partisanship of districtings since the 19th century. Each of the simulated maps undergoes this partisan bias analysis. In the application of his method, Dr. Pegden finds that the partisan bias as measured by the Median vs. Mean test quickly decreases as his method makes small changes to the map.
For example, the court on Monday heard testimony from petitioner Beth Lawn, who lives in the 7th district, the one nationally recognized as looking like “Goofy kicking Donald Duck.” In the maps generated by Dr. Pegden’s method, he noted “the shapes of Goofy and Donald Duck start to get fuzzier with each small change. Districting quickly becomes fairer. It really shows that Pennsylvania’s districting has very fragile partisan bias which is extremely carefully crafted.”
Dr. Pegden’s report concludes that the current plan exhibits more partisan bias than 99.999999% of the maps his method produces. He testified , “Our method really shows that political geography and the geometric features of the current districts can’t explain the partisan bias in the current map. There is plenty of evidence that it is possible to draw a much better map than the current map.”
Dr. Pegden also analyzed the anti-competitiveness of the current congressional map using the same basic method. Dr. Pegden testified that the maps created are not intended to be alternatives to the current map. They are simply created to make comparisons to the current map to analyze partisanship.
In conclusion, Dr. Pegden testified that the current congressional districting is an extreme outlier among a robust set of all alternatives and that his analysis proves that neither political geography, nor traditional redistricting criteria, can explain why Pennsylvania’s current map has such extreme bias.
After cross examination, Elisabeth Theodore, an associate with Arnold & Porter Kaye Scholer LLP, examined expert witness Dr. Christopher Warshaw.
“The efficiency gaps in Pennsylvania today are extremely large, both relative to historical efficiency gaps, but they are also large relative to the efficiency gaps in other states. We have only seen these larger efficiency gaps since the 2011 map was enacted. We hadn’t seen anything like this in previous elections.” – Dr. Christopher Warshaw
Born in Mechanicsburg, Pennsylvania, Dr. Warshaw is an Assistant Professor of Political Science at George Washington University. An expert on American politics, his studies focus on political representation, public opinion, elections and polarization.
Dr. Warshaw was retained by petitioners to develop an expert report answering the following:
- evaluate the degree of partisan bias in the redistricting plan in Pennsylvania and place the degree of partisan bias in Pennsylvania into historical perspective.
- evaluate the growing polarization of members of the Congress, and whether that polarization magnifies the effects of gerrymandering.
- examine the consequences of the 2011 redistricting plan on the representation that Pennsylvania residents receive in Congress in the context of growing polarization in Congress.
- examine the consequences of the 2011 redistricting plan in Pennsylvania on citizens’ trust in government.
Dr. Warshaw’s testimony began with his findings that, “When there is a large partisan bias in a redistricting process, it really degrades citizens. Citizens whose votes are wasted are much less likely to trust their elected officials. Redistricting across the country, and in Pennsylvania, is really degrading our democracy and eroding citizen faith in our democracy.”
He then explained his use of a formula known as the Efficiency Gap (EG) to measure partisan advantage in the redistricting process. The efficiency gap is defined as, “the difference between the [political] parties’ respective wasted votes divided by the total number of votes cast in the election.” This calculation was developed in 2014 and has been used to evaluate other redistricting plans, such as the map currently before the U.S. Supreme Court in the Wisconsin redistricting lawsuit, Gil v. Whitford.
Dr. Warshaw testified that a gerrymander happens when more votes of one party are wasted than for the other party. Wasted votes are votes which do not result in electing a candidate or which are in excess of those needed to win a district. For example, in any given district, a political party only needs 51% of the vote to win that district. If a party wins by 80%, 29% of the votes in that district were wasted because they were not needed for the party to win, only 51% are needed. Wasted votes are calculated by looking at actual election results in each district.
Dr. Warshaw testified that votes are wasted when voters of one political party are intentionally “cracked” or ”packed” into specific districts. “Packing” means voters of one political party are concentrated into as few districts as possible. “Cracking” means voters of one political party are spread out over as many districts as possible to dilute the collective power of their vote. A gerrymander wastes as many of your opponents votes as possible and wastes as few of your own parties votes as possible.
Dr. Warshaw’s analysis calculated the Efficiency Gap in Pennsylvania and in all states with more than 6 congressional seats for each congressional election from 1972 through 2012. His historical analysis shows that the vast majority of EGs across the nation over the last three decades lie close to zero and only about 4% showed a EG greater than 20 percent. When an EG is zero, it indicates that each party is wasting the same number of votes. But more recently, specifically after the 2011 redistricting process took place across the country, EG values have increased to favor Republicans, especially in Pennsylvania where in the last three congressional elections the EG was 24% in 2012, 15% in 2014 and 19% in 2016. He noted, “I found that there is a large and durable Republican advantage that spiked dramatically after the 2011 congressional plan went into place. In Pennsylvania, the EG in 2012 was the largest in the country, and the second largest in history.” He also testified, “The Efficiency Gaps we’ve seen after the 2011 congressional map went into place are extreme relative to previous redistricting plans we’ve seen in Pennsylvania.”
Ms. Theodore asked Dr. Warshaw if there are possibly other factors, like political geography, that could have caused the EG to grow so dramatically in Pennsylvania after 2011. “In my judgement, no. Political geography changes over time but it doesn’t change over the course of a two-year period. There is no possible geographic change that between 2010 and 2012 could explain the change we have here.”
He testified further that, “The Efficiency Gap that occurred immediately after the 2011 map went into place is extremely persistent and durable and unlikely to be remedied unless the courts step in.”
Dr. Warshaw was also asked to respond to an expert witness retained by the legislative respondents, Dr. James G. Gimpel. Dr. Gimpel produced a report using the Efficiency Gap, however, he came up with different figures than Dr. Warshaw. Dr. Warshaw refuted Dr. Gimpel’s use of calculating the EG using party registration figures, instead of using actual election results. In general, Dr. Warshaw testified that part registration is not a good predictor of how a person actually votes in a congressional election. “Given we have the data of how people voted, I find that to be a much better source of information. I don’t see the relevance of party registration.” Dr. Warshaw also pointed out that Dr. Gimpel used incorrect data in his report. His data incorrectly shows that the 12th congressional district in Pennsylvania was held by a Democrat, when in fact it was not, giving his data a 12-6 Republican-Democrat seat make up, instead of the actual 13-5 breakdown.
Dr. Warshaw also testified about the effect the partisan bias in the current map has on the representation Pennsylvania voters receive in Congress. He noted that there is a consensus among political scientists that polarization in Congress has increased dramatically over the last forty years. To confirm this consensus, Dr. Warshaw reviewed roll call data of Pennsylvania’s congressional delegates from 1972 through 2016. In the 1970s, there was some overlap in terms of when Republicans and Democrats voted the same on roll call votes. In the 1980s and 1990s there was also some overlap, although slightly less. However, he found that, “As you move over time, the overlap between parties has diminished considerably. Today there is no overlap between the parties. If you elect a Republican, there is a high chance they will be more conservative than the most conservative Democrat you could have elected. The average ideology of the parties has diverged significantly and there is a large gulf between the parties and how they vote.” Today the difference between how Democrats and Republicans vote on legislation is twice as large as it was the 1970s.
Dr. Warshaw also analyzed how gerrymandering can impact representation. He found that in states like Pennsylvania, where there is a pro-Republican Efficiency Gap, democratic voters are increasingly unlikely to agree with their representatives on their roll call votes and are therefore disadvantaged from being represented in congress. “Citizens whose votes are wasted aren’t able to influence their members of congress’ roll call positions. This shows that gerrymandering has large and pernicious effects on democratic participation in Pennsylvania.”
After Dr. Warshaw’s testimony, counsel for the petitioners moved to admit a variety of exhibits, including data and maps produced in discovery in the federal redistricting trial. Judge Brobson sustained objections to them by the Legislature, only allowing them to be admitted under seal so that the Pennsylvania Supreme Court could have the opportunity to review his evidentiary ruling. He noted none of these exhibits could be cited by any parties in their post-trial briefs.
The Petitioners then rested their case. David Gersch of Arnold & Porter Kaye Scholer LLP told the court Petitioners have demonstrated violation of freedom of expression and association, as protected under the Pennsylvania Constitution. “Voting is a core freedom of expression. Affiliating with the party of your choice is a core association. Act 131 burdens both of these things. Petitioners like Bob Smith submitted in their depositions that there is a good chance they would have been in a different district where there votes would have mattered more. We showed harm to each petitioner. Mr. Gersch also noted that through expert witness testimony has demonstrated intentional discrimination.
Counsel for the Lieutenant Governor noted support of the petitioners’ position. Judge Brobson then rejected Legislative Respondents request to rule that Petitioners had not proven their case.

Trial will resume tomorrow with the legislative respondents putting on their expert witnesses.
Trial Day 2: December 12, 2017
Day two of trial began with Daniel Jacobson of Arnold & Porter Kaye Scholer LLP completing his examination of petitioners’ expert witness Dr. Jowei Chen. Much of this testimony was elicited to respond to criticisms levied by legislative respondents’ expert Nolan McCarty.
“There are a lot of different methods flying around in his [McCarty’s] report.” – Dr. Jowei Chen
Dr. Chen first testified that each of the 1000 simulated maps he produced and analyzed in his report are independent of every other simulated map in his reports. Each map started afresh from a randomly generated point; none start from another simulated map or from the map as enacted by the legislature. Dr. Chen distinguished his methodology from a completely different process: the Monte Carlo Markov chain, which is iterative, that is, in which one map is derived from another. Dr. Chen did not use this algorithm. Dr. Chen discussed why he chose to generate and analyze 1000 simulated maps as opposed to some larger number. He noted that it is general statistical practice that one needs to review at least 25 “populations,” or in this case simulated maps. Dr. Chen ran 1000 simulations, two sets of 500, such that he would have enough simulated maps should he need to go back and review a particular subset of those maps. (Chen testified the day before that he had in fact reviewed the subset of maps in which there was a majority of African Americans in at least one district.)
Dr. Chen also testified regarding legislative respondents’ expert report by Nolan McCarty. Counsel for legislative respondents Speaker of the Pennsylvania House of Representatives Michael C. Turzai and President Pro Tempore of the Pennsylvania Senate Joseph B. Scarnati retained McCarty, the Susan Dod Brown Professor of Politics and Public Affairs Chair at Princeton University, to review and analyze Dr. Chen’s expert report, as well as petitioners’ expert report from Dr. Christopher Warshaw, which focuses on the efficiency gap and will be examined during trial on Wednesday.
In his report, McCarty used his own methodology to analyze the 1000 maps generated by Dr. Chen and concluded that the map as adopted by the legislature was not as much of an outlier as it appears from Dr. Chen’s analysis.
Dr. Chen testified that McCarty was only able to reach his conclusion by applying one set of data and one methodology to analyze the map as adopted by the legislature and a different set of data and different methodology to analyze the 1000 maps generated by Chen. Dr. Chen showed how the choices D. McCarty made about the data used and the methodology applied introduced a systematic bias into his analysis.
Next, attorney Patrick Lewis from Baker Hostetler, representing Speaker Turzai, cross-examined Dr. Chen.
“I want the world to see the entire computer code and algorithm.” – Dr. Jowei Chen
During cross, Dr. Chen repeatedly noted that he turned over all of his computer code and data files, which lay out in detail and step-by-step, his algorithm and methodology. (This information is available on his website.) At the request of cross-examining counsel, he reviewed his methodology. He began his calculation using U.S. Census tract data, which is the data used in the creation of congressional plans, including the current map. His algorithm then relies on a hierarchy of traditional redistricting principles, such as maintaining an equal population in every district and maintaining as much geographic contiguity as possible, to draw simulated maps. As the computer creates maps, the computer algorithm is instructed not to split up more counties than necessary and to avoid municipal splits. It attempts to draw each map approximately 10 different ways. For each simulated map, it picks the option that most reasonably limits county and municipal splits and then proceeds to select the most compact district. Dr. Chen repeated his earlier testimony that each simulated map starts at a fresh, randomly selected point.
Mr. Lewis asked Dr. Chen if his simulation models use the Monte Carlo simulation model, which Dr. Chen confirmed his models do not. Mr. Lewis also asked Dr. Chen if he was aware that the Pennsylvania Constitution does not require traditional redistricting criteria in creating congressional maps. Dr. Chen responded that while the state’s constitution does not speak to congressional districts, it does contain requirements for state legislature redistricting plans: they must, “be composed of compact and contiguous territory as nearly equal in population as practicable,” similar to the traditional criteria Dr. Chen used in his expert report. Dr. Chen also responded to a line of questioning from Mr. Lewis that he does not believe preserving prior districts or avoiding contest between incumbents are legitimate state objectives in creating a new map, as they are not part of the widely-accepted traditional redistricting criteria he uses.
During cross examination, Dr. Chen noted, “I asked petitioners’ counsel for every nonpartisan criteria employed by the legislature in creating the enacted map, but the General Assembly refused to turn that information over.” He noted he could have used and incorporated any such criteria into his simulations had it been made available. He concluded by testifying again that, “I found that there was a partisan intent to favor Republicans,” in the enacted map.
Following Mr. Lewis’ cross-examination, Clifford Levine of Cohen & Grisby, representing Lieutenant Governor Michael Stack, briefly cross-examined Dr. Chen. Dr. Chen’s testimony concluded with redirect by Daniel Jacobson of Arnold & Porter Kaye Scholer LLP.
John Freedman of Arnold & Porter Kaye Scholer LLP then examined petitioners’ expert witness Dr. John J. Kennedy, professor of political science at West Chester University. Dr. Kennedy produced an expert report analyzing the history of Pennsylvania U.S. Congressional maps from the 1960s through the current 2011 map and identifying anomalies in the current map.
“The 2011 map carves up Pennsylvania’s communities of interest at an unprecedented level and contains more anomalies than ever before. In addition, the 2011 map gives precedence to political considerations over considerations of communities of interest and disadvantages democratic voters as compared to republican voters. This is a gerrymandered map.” – Dr. John J. Kennedy

Dr. Kennedy was asked by petitioners’ counsel to look at whether or not partisan considerations would or can override historical criteria in redistricting. He was also asked to address whether or not the 2011 map has an impact on Pennsylvania’s “communities of interest” and if so, if any conclusions can be made about partisan effect overall. Finally, he was asked to examine anomalies in the current map. (A community of interest is a group of people with common interests.)
Dr. Kennedy testified that he took a detailed review of the current map and then looked at previous maps beginning in 1966, a year that marks the modern era of redistricting. His overall conclusion is that the 2011 map:
- negatively impacts communities of interest to an unprecedented degree;
- places partisan considerations above those of communities of interest;
- contains more anomalies than ever before; and,
- favors republican voters over democratic voters.
Dr. Kennedy testified that for Pennsylvanians, community is very important to identity. Residents of “Delco” have a different identity than those in Amish country, for example. In his report and his testimony today, he said, “As Pennsylvania historian Dr. Philip S. Klein once noted, Pennsylvanians “lack a real sense of identity, because traditionally people’s allegiance has centered around their home towns rather than the total entity of the state…Ask a Texan where he comes from and he’ll almost always say ‘Texas.’ But a Pennsylvanian is more likely to respond with the name of his home town…”
Dr. Kennedy explained for the court the terms cracking and packing, two of the most notable ways to achieve a gerrymandered map. “Cracking is where you separate or divide opposite party loyalists in order that they cannot form a larger, cohesive political voice. Packing is the opposite. You’re taking individual groups who reside in different communities and packing them together simply based on their partisan performance, lessening their impact over a broad area.”
During his testimony, Dr. Kennedy was asked to review a number of the individual 18 congressional district maps and discuss anomalies he found. He looked for things that are not natural, like an isthmus or narrow tract of geography that connecting two communities and placing them in the same district even though they do not share common interests.
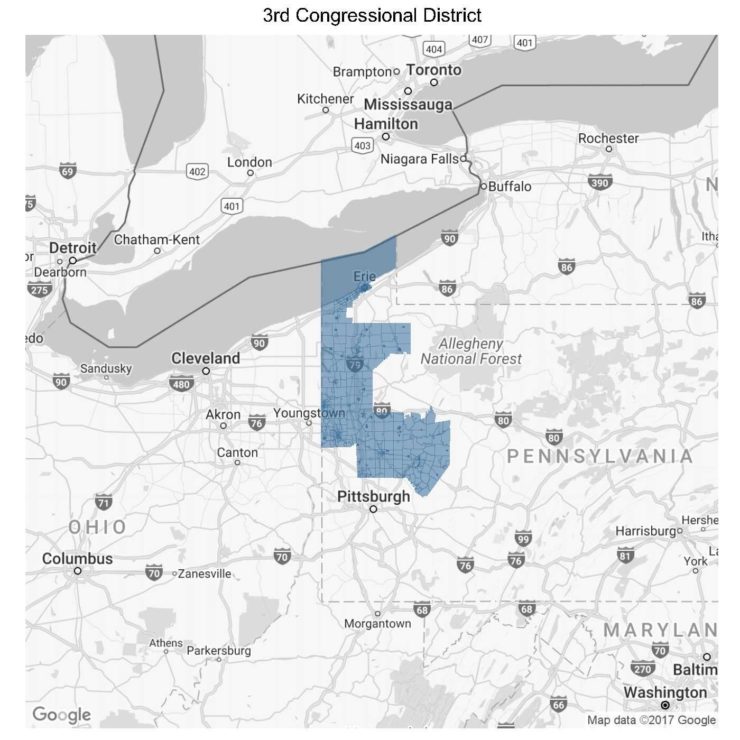
For example, Dr. Kennedy reviewed the 3rd congressional district map for the court. The 3rd district begins in northwest corner of Pennsylvania in Erie county and winds down to Crawford county and Mercer county, before heading west into Butler and Venango counties. He testified that Erie county is the most populous county in this district, and has been split in two under the current map. He found no apparent nonpartisan explanation for why Erie county, which had never been split previously, is split in half, other than to create a cracking of democratic vote and separate a community of interest. “The county voice of voters, democrats in particular, is diluted by pushing eastern parts of Erie into the 5th district and diluting what is left into the 3rd district.”
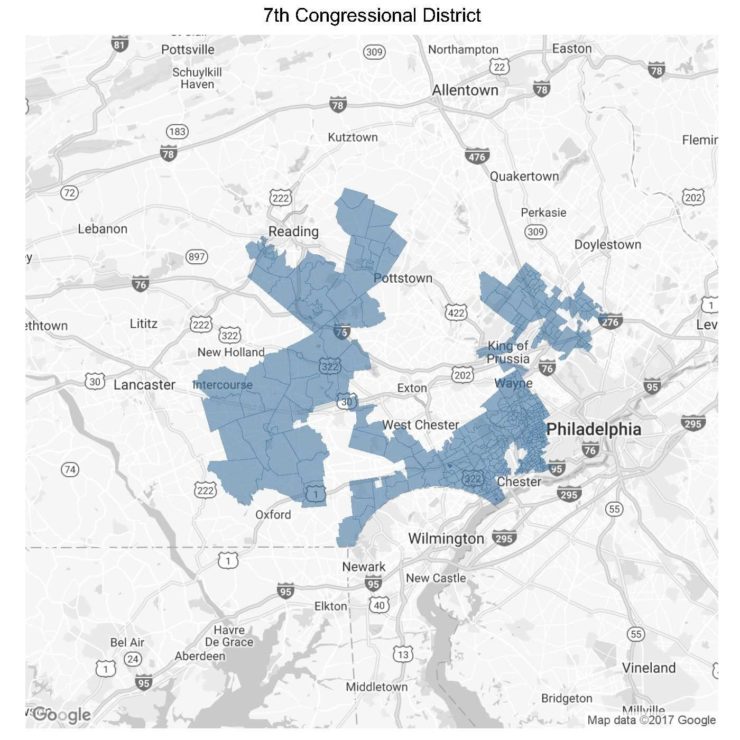
Dr. Kennedy also reviewed the infamous 7th district, known as “Goofy kicking Donald Duck,” which he noted, “has become famous certainly statewide, if not nationally, as one of most gerrymandered districts.” Historically based in “Delco,” he noted the seventh district is, ”essentially two districts in one,” connected at different points by a medical facility that spans the length of two football fields and at another point only connected by Creed’s Seafood and Steakhouse. He testified that the 7th district grabs parts of the city of Chester and other democratic communities like Swarthmore in which to pack democrats.
Robert J. Tucker, an attorney from Baker Hostetler representing the legislative respondents cross examined Dr. Kennedy. Mr. Tucker asked a series of questions attempting to make clear that Dr. Kennedy is not a redistricting expert, has never drafted a map, nor is he an expert on a variety of voting criteria, such as the Voting Rights Act or compactness measurements. Dr. Kennedy responded that he was asked to focus on how communities of interest were impacted and that he believes protecting communities of interest is a valid redistricting criteria.
Mr. Tucker also pressed Dr. Kennedy to agree that protection of incumbents and ensuring longevity of Congressmen is a legitimate interest in redistricting. Dr. Kennedy strongly disagreed, asserting that if voters believed their Congressmen were not doing their jobs, the Congressmen should be turned out of office.
Ben Geffen, staff attorney with the Public Interest Law Center examined petitioner Thomas Rentschler.
“I just find that the 2011 plan has really diluted what I believe is my participation in the voting process and in selecting leaders. I believe the plan has been structured such that the politicians have picked voters in so many places and that’s not the way it should work. We should be picking the politicians.” – Tom Rentschler
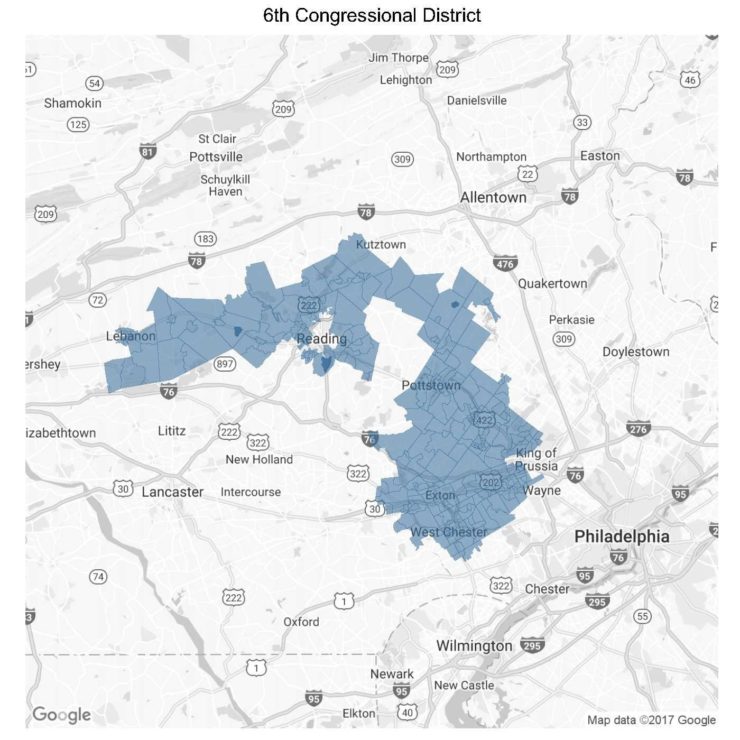
Tom is a registered democrat from the 6th Congressional District who has consistently voted for Democrats in all primary and general elections, noting during his testimony, “I believe it is my civic duty to elect people to represent me on the local, state and national levels, and in this case, the U.S. congressional district level.” A former school teacher and current attorney, Tom was born and raised in Berks County. He currently lives in a largely middle class community of about 50,000 in Exeter township, just two miles from the city of Reading. His Congressman is Republican Ryan Costello.
Prior to the current 2011 map, his district was competitive, with four of five pre-2011 congressional elections decided by a margin of less than five points. But under the current map, the district has been far less competitive and a Republican representative has won each election by more than twelve points.
Tom does not feel represented by Congressman Costello on a number of issues. For example, Tom has had Type 1 Diabetes for the last 33 years. Being without health insurance could be catastrophic for him. When he was first diagnosed, there was nothing like the Affordable Care Act (ACA) to provide him protections from being denied insurance because of his pre-existing condition. When he was in his twenties, there were three occasions during which he had to wait a year to gain health insurance and he repeatedly switched jobs solely so he could access health care. Now, under the ACA, he cannot be denied insurance, but Representative Costello has repeatedly voted to repeal or undermine the ACA.
Tom’s also worried about his children’s health insurance. He has five children in their late teens and early twenties who are currently able to access his health insurance until they are 26-years-old, thanks to the ACA. He’s worried that will get taken away because of Representative Costello’s voting record.
Tom is also worried about Representative Costello’s support of the proposed federal tax bill, which would roll back student loan deductions, of which he and his college-aged children currently take advantage. And, Tom has two other children waiting to go to college. He testified that the current tax bill, if passed, “will affect me and my family for a long time.”
Tom also testified about how his district doesn’t make sense to him geographically. Tom lives just two miles from the city of Reading, but his neighborhood has been carved out to be in a separate district. Reading, one of the poorest cities in the nation and importantly, the county seat of Berks. Living so close to the city line, the city’s economy, social life and sports life are a big part of Tom’s life. He doesn’t believe his neighborhood should be separated out from a geographic area that it relies on. “It’s hard for me as a citizen to comprehend how the city two miles from my house is not in my district, but I’m in same district as Eastern Lebanon City, which has no connection to my location.”
Tom also testified that he’s concerned with the statewide impact of the current map. “I just take the position that congressional districts across Pennsylvania should be drawn in a way that is fair. I’m just asking for something that is fair and drawn for reasons that make sense.”
Tom was cross-examined before court was adjourned for the day. Court will resume at 9:30 tomorrow morning, with the petitioners putting on their final expert witnesses of Christopher Warshaw and Wesley Pegden.
Trial Day 1: December 11, 2017
Judge Brobson started the day hearing argument from both sides on eight motions in limine and issued decisions on the motions. The court:
- denied the state legislators’ motions to exclude information about the Republican Redmap;
- ruled that evidence produced in a separate federal court case (Agre) could only be used if it was actually used in the federal court case;
- denied the petitioners’ motions to exclude one expert (after the lawyers for the legislators agreed to withdraw most of the report) and denied the petitioners’ motion to exclude a second expert report;
- accepted the petitioners’ argument that candidates for office should not be allowed to testify;
- and granted the petitioners’ motion to exclude any evidence about the legislature’s intent in framing the congressional districts, since the court had previously held that the petitioners could not inquire into the legislature’s intent in discovery.
Before hearing the petitioners’ witnesses, Judge Brobson noted his charge to create as fulsome a record as possible for the Pennsylvania Supreme Court justices to review. In particular he will issue Findings of Fact and Conclusions of Law, which the Pa. Supreme Court will then use to issue a final decision in the case.
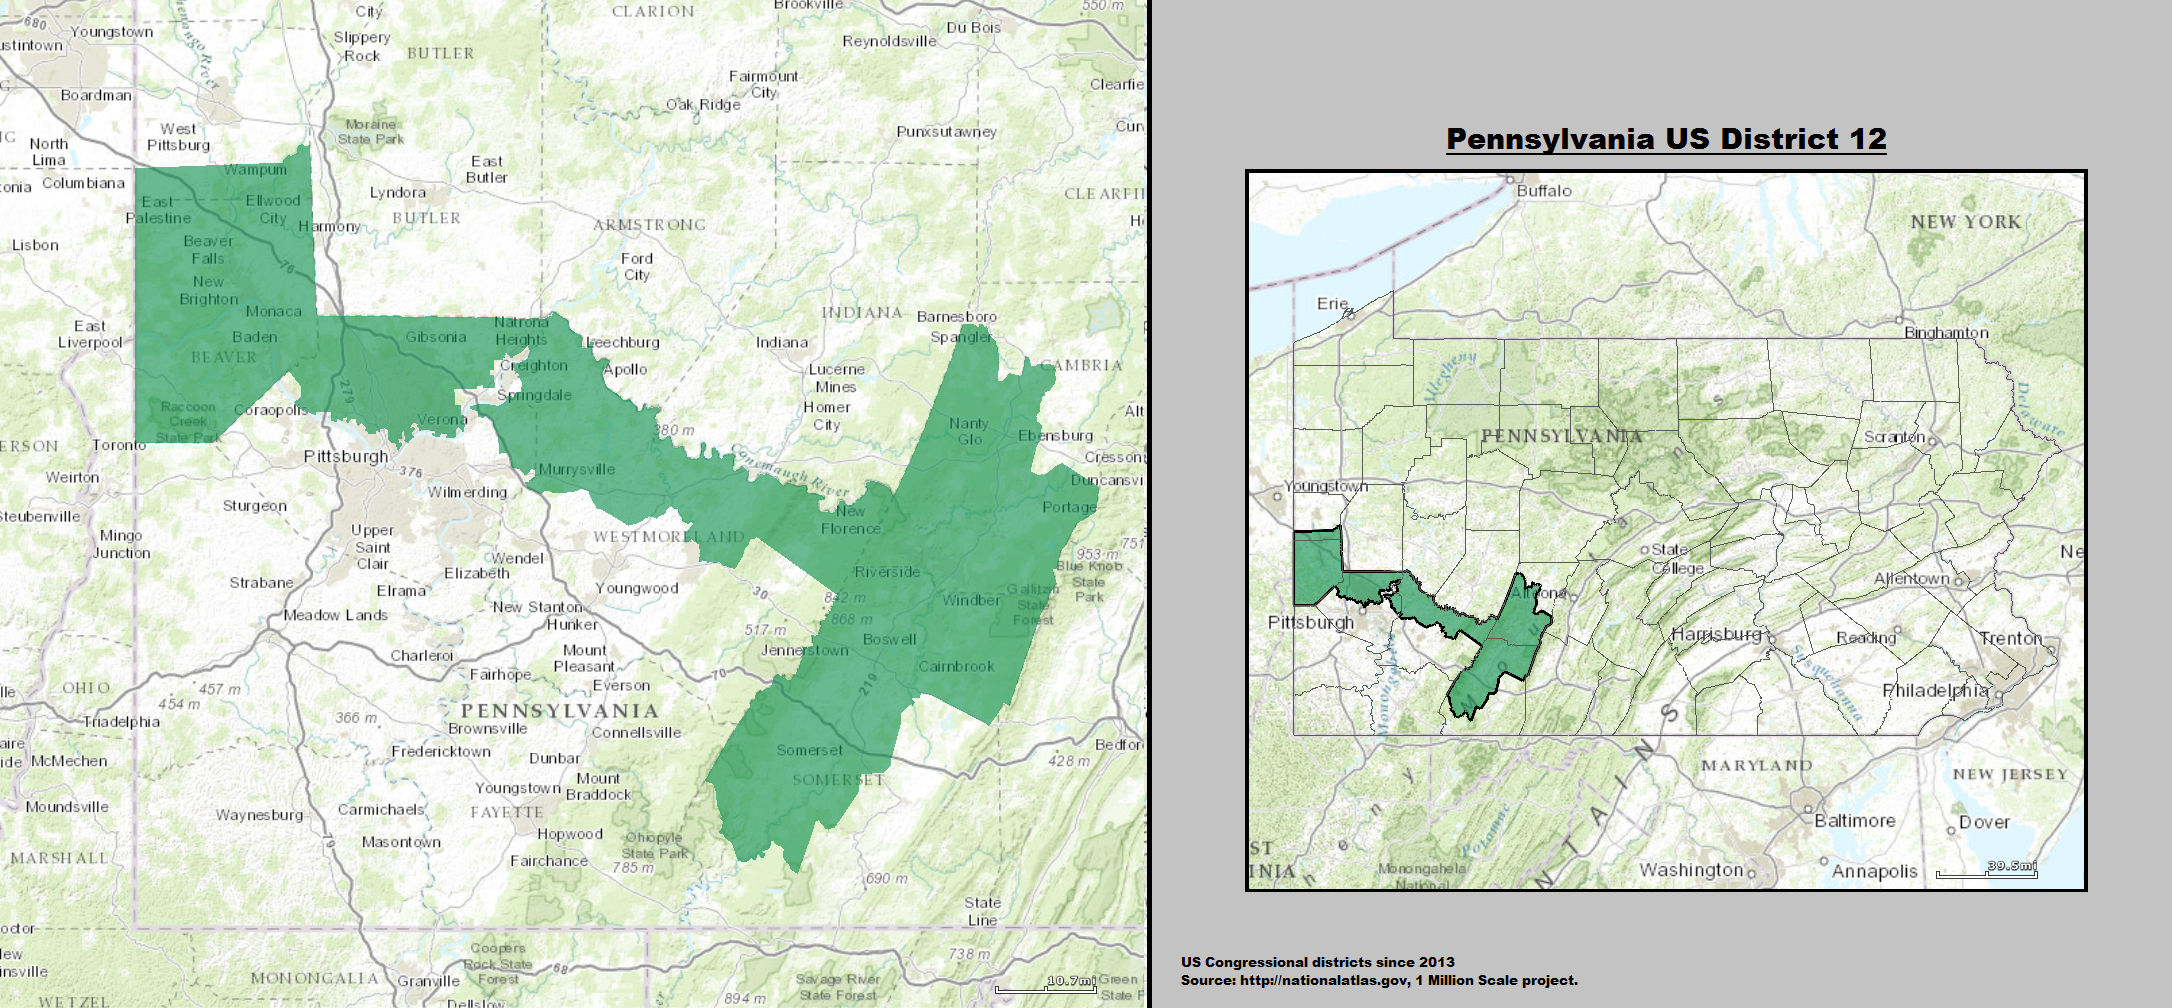
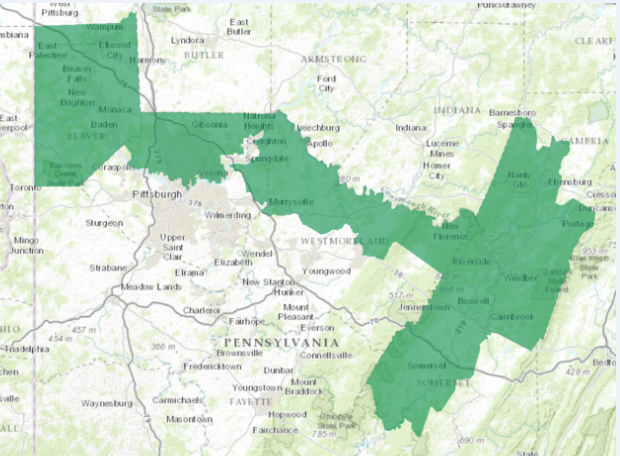
Next, Mimi McKenzie, Legal Director for the Law Center, began the trial by examining petitioner Bill Marx, who lives in the 12th District. Bill served in the Marines as a military policeman and a helicopter pilot.
“When I came back from deployment, I wanted to make the town I live in a better place for my family. Serving in the military is one way that I serve my country. I feel that voting and being a part of the political process is another way.” – Bill Marx

Bill took the stand after traveling back from a weekend of training with the army reserve. A father and a Pittsburgh public school teacher, Bill has served in the Marine Corp., the Army, and now the Army Reserves. Bill was also recently elected to his local borough council. Bill is a registered Democrat who has voted in every election, including school board elections. He brought his high-school-aged daughter with him to watch the trial. He is particularly concerned about the apathy of many of the seniors in his AP U.S. History class. When he explains gerrymandering to them, they respond by saying, “Well then why should we vote?”
Bill’s congressional district weaves its way from the southwestern Ohio boarder through the north hills of Allegheny County into the northern half of Westmoreland County, into southern Cambria County and through the northern part of Sommerset County. He testified that the current map has taken away his ability to express his vote for a competitive candidate. The makeup of his district allows no chance for a Democratic candidate to win. “I want competitive districts, and a chance to be able to put someone in there who would represent me, or a chance to hold someone accountable that if they don’t represent me.”
Bill is currently represented by Congressman Keith Rothfus. Bill cannot get through to him to voice his concerns. Bill has attempted to reach out to Rep. Rothfus’ offices on multiple occasions, but regularly gets a busy signal or full voice mail. And the Congressman has held no town halls. But Bill is concerned about a number of legislative issues, such as the current federal tax bill, which could take away tax deductions for teachers like him and for student loans, of which he has a significant amount. He’s also concerned about the Violence Against Women Act, which is important to him and his daughter, but which Rep. Rothfus has voted against. Polling in his community has shown that most people favor these issues, but Rep. Rothfus is not representing their values.
Bill doesn’t need his representative to be a Democrat. When Bill was part of the fourth district, under the pre-2011 map, he had a Republican representative who was responsive and who was willing to meet with him to discuss his concerns. Currently, he feels Rep. Rothfus has no incentive to reach out and meet with him because he feels safe in the district.
Mimi McKenzie then examined Mary Elizabeth Lawn, petitioner from the 7th District.
“I have children and grandchildren and I have an obligation to them, to the future generations, to bring back a sense of fairness and listening to each other.” – Beth Lawn
Beth Lawn lives in, as she calls it, “Goofy’s finger”, a sliver of Pennsylvania’s 7th U.S. Congressional district, the one widely known to look like “Goofy kicking Donald Duck”. A chaplain at a retirement community, she is a registered Democrat who has voted in every election since she was 18-years-old.
Chester is a poor, largely African-American city of 32,000 that has lost its industrial base in recent years and has a high rental population. Under the current map, only Beth’s street and a few streets around her block are in the 7th district. The rest of the city is in a different district entirely. But before the 2011 map was enacted, Beth lived in a district that included all of Chester. This split concerns Beth. Although they’ve been carved into separate districts, she and her neighbors a few blocks away share many of the same concerns, such as access to health care.
Beth is currently represented by Congressman Patrick Meehan, but she has numerous concerns that Representative Meehan does not share. For example, she is concerned about the current federal tax bill as she believes it disadvantages poor people and allows for drilling in the arctic preserve. Also, both of Beth’s son’s and their families depend on the individual mandate of the Affordable Care Act and Medicaid expansion to receive health care. She is worried that the tax bill will remove the mandate, leaving her children and grandchildren without health care.
Over the last year, Beth has reached out to Rep. Meehan’s office to voice her concerns and traveled to his local office, however she has not received much response and often has received confusing responses from his staffers. “Rep. Meehan does not represent my point of view on any of these issues. My family has been under a great deal of stress and worry about whether they’re able to work and whether or not they could be left to need public assistance without the Affordable Care Act. I know many who are very much in need of health care under the ACA, especially in Chester.”
Beth feels frustrated that statewide, the current map favors Republican districts and she is worried about disengagement. “I talk to people who say there’s nothing we can do. In the 7th district we feel we can’t get the attention of our representative, he has no incentive to listen to us. I don’t need someone who represents me on every issue I care about, but if we have competition and debates, we’d have the opportunity for people to engage and candidates to engage with us, and it wouldn’t matter in the end if our representative was a Democrat or Republican, but they would have to be accountable to us.”
Finally, attorney Daniel Jacobson of Arnold & Porter Kaye Scholer LLP examined petitioners’ expert witness Dr. Jowei Chen.
“Act 131 significantly subordinated traditional redistricting criteria of avoiding county and municipal splits; it split far more counties and municipalities than would have arisen under a process following traditional redistricting principles.” – Dr. Jowei Chen
Dr. Jowei Chen is an Associate Professor in the Department of Political Science at University of Michigan Ann Arbor. He studies redistricting and the residential and geographic patterns of voters and their behaviors, and how that information affects or results from the redistricting process. He has been an expert in multiple redistricting cases across the country.
For this case, Dr. Chen used computer simulations, and followed traditional redistricting principles, to create 1000 simulated congressional district maps and compare them against the current congressional map.
In particular, he testified that he was asked by the petitioners’ counsel to evaluate the following three questions:
- Whether partisan intent was the predominant factor in the drawing of the 2011 enacted Act 131 districting plan;
- The effect of the enacted plan on the number of congressional Democrats and Republican elected from Pennsylvania; and
- The effect of the enacted plan on the ability of the individual Petitioners to elect a Democratic or Republican congressional candidate from their respective districts.
Traditional redistricting principles, which are enshrined in Pennsylvania’s constitution, include:
- Equal population in each district
- Maximum geographic compactness of each district
- As much preservation of county and municipal boundaries as possible
Dr. Chen walked the court through a variety of his simulated models and how they compare to the current congressional map. For example, he demonstrated that the current plan divided far more counties than any of the 1000 simulations he ran. The current plan splits 28 counties. Of 500 simulated maps that follow traditional redistricting principles, the number of county splits among all 500 maps range from just 11 to 16 county splits. Of another 500 simulated maps in which he showed maps that protect incumbents, while otherwise following traditional redistricting principles, all of his 500 simulated maps range from making just 12 to 19 county splits. He concluded that with over 99.9% statistical certainty, the current map’s split of 28 counties could only have emerged because of partisan intent.
Dr. Chen also described the computer files which had been produced by the legislature in a separate federal case. The lawyers for the legislature had described those files as having been relied upon to create the current Congressional lines. Dr. Chen described the files. For example, the file included assessments on a precinct basis of whether people voted for Democratic or Republican candidates in state, federal and presidential elections over the period of a decade. The files are available here.
Broadly speaking, Dr. Chen’s statistical analysis shows partisan intent predominated the drawing of the current congressional map, and ignored traditional redistricting principles, creating a 13-5 advantage in favor of Republicans. His full report, which was laid out before the court, can be read here. His website, which includes his data and methodology, can be found here.
Court will resume at 9:30 a.m. tomorrow morning, with the counsel for the petitioners finishing examination of Dr. Chen and moving on to examine additional petitioners and expert witnesses.